IS001 Quick Answer
R. L. Snyder, Biometeorology Specialist
Department of Land, Air and Water Resources
University of California
Davis, CA 95616, USA
N.V. O’Connell, Farm Advisor
UCCE Tulare County
Ag Bldg Co Civic Ctr
Visalia, CA 93291, USA
Soil Volume and Saturation
In water balance irrigation scheduling, the soil water content is either measured or estimated and the soil is irrigated before the depletion of water below field capacity exceeds the yield threshold depletion. In general, soils about half solid and half pore space. When saturated with water, then the soil is about half solid and half water. If a soil is thoroughly wetted and then allowed to drain for a few days, there is a sharp decrease in the rate of drainage when it reaches field capacity (qF). If plants are allowed to further deplete water from the soil, the water content will decrease until it reaches the permanent wilting point (qP), which is typically about half of qF. The water held in the soil between field capacity and the permanent wilting point is called available water (qA). Note that the values qF, qP, and qA are all soil water holding capacities with the units inches of water per inch depth of soil. To determine the field capacity (FC), permanent wilting point (PWP), and available water (AW) content in inches for a known depth of soil, the water holding capacities are multiplied by the soil depth (d) in inches (e.g., FC=qF ´ d, PWP=qP´ d and AW=qA´ d). The variables FC, PWP, and AW are soil water contents rather than water holding capacities.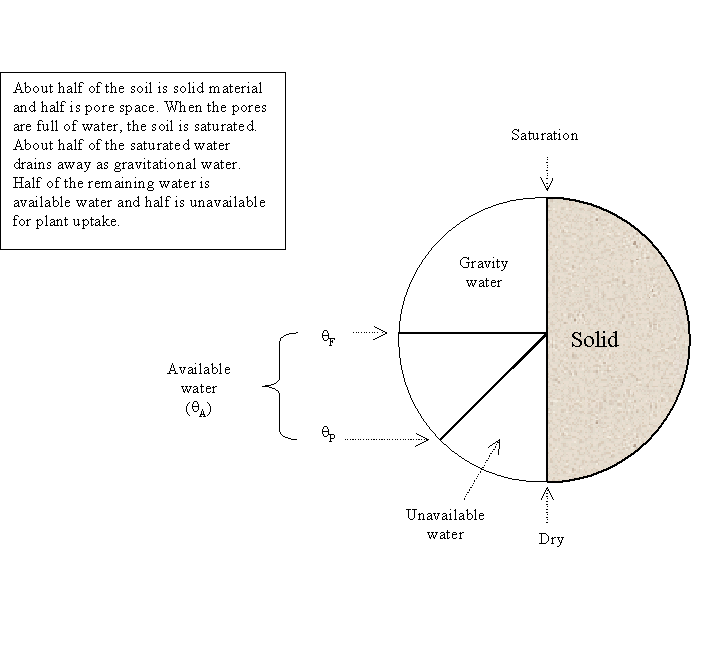
For irrigation scheduling, the water content of the rooting depth is needed. For a soil with uniform water holding characteristics, multiply qA by the rooting depth to determine the plant available water (PAW). This is the quantity of water held between field capacity and the permanent wilting point within the crop rooting depth. For a soil that changes qA with soil depth, calculate the available water (AW) by uniform soil layer and sum the results to get the plant available water (PAW= SAW) for the rooting depth. Sample qA ranges by soil texture are given in the following table in inches per inch and in inches per foot.
Range of available water content by soil texture
| Soil Texture | Available Water (inches in-1) | Available Water (inches ft-1) |
| Sand | 0.04-0.06 | 0.48-0.72 |
| Loamy sand | 0.06-0.09 | 0.72-1.08 |
| Sandy loam | 0.07-0.12 | 0.84-1.44 |
| Loam | 0.08-0.15 | 0.96-1.80 |
| Clay loam | 0.10-0.18 | 1.20-2.16 |
| Clay | 0.12-0.21 | 1.44-2.52 |
For example, assuming a rooting depth of 2 ft for a uniform soil having qA=2.0 inches of water per foot depth of soil, multiply 2.0 ft by 2.0 to get PAW=SAW=4.0 inches. For soils that are not uniform with depth, the AW is calculated by layer and summed to obtain the PAW. A sample calculation is shown below.
Sample SAW calculation with variable qA
| Layer | Depth (in.) | qA (in in-1) | AW (in.) | PAW (in.) |
| 1 | 6 | 0.16 | 0.96 | 1.44 |
| 2 | 6 | 0.17 | 1.02 | 1.98 |
| 3 | 9 | 0.16 | 1.44 | 3.42 |
| 4 | 9 | 0.13 | 1.17 | 4.59 |
| 5 | 6 | 0.12 | 0.72 | 5.31 |
PAW Correction for Wetted Volume
If not fully wetted, then the PAW calculation needs a correction for the wetted volume. If the entire field is wetted, then the full volume (VF) is calculated as the product of the surface area and the rooting depth. For a partially wetted surface area, multiply the wetted surface area by the rooting depth to estimate the wetted volume (VW). If the water is known to spread laterally below the surface, increase the wetted surface area to compensate for the lateral spread of the water.
The correction factor (CV) for the wetted volume is
The PAW is calculated as![]()
Example:
If the SAW for the fully wetted soil is 3.6 inches and a micro-sprinkler system wets only 1/3 of the soil volume, then![]() inches
inches
Yield Threshold Depletion (YTD)
Although plants can potentially withdraw most of the PAW from a soil, they will start to experience water stress, which reduces plant growth as well as photosynthesis and transpiration rates. The water content where a crop is expected to start experiencing yield reducing water stress is called the yield threshold (YT) and the difference between FC and YT is called the yield threshold depletion (YTD). The YTD is often defined in terms of the allowable depletion (AD), which is the percentage of plant available water corresponding to the YTD.
For many crops, the allowable depletion is about 50% of the PAW. However, the AD really depends on plant, soil, and weather factors. Generally, an AD less than 50% is selected for water stress sensitive crops or crops with limited root length density. An AD greater than 50% is chosen for drought tolerant crops with an extensive root system. Under conditions of high evaporative demand (i.e., high ETo rates), the AD should be reduced. AD can be raised under conditions of low evaporative demand. In general, an AD=50% should be adequate for citrus.
Example:
Using the PAW=1.33 inches that was calculated earlier and AD=50%, then![]() inches
inches
Application efficiency (AE)
The net application amounts calculated in the previous example are the amounts of water that would be applied to the field if the water were applied uniformly over the field and at the correct depth. However, no irrigation systems apply water with perfect uniformity and; therefore, some over-irrigation is necessary to insure that all parts of the field receive adequate water. This means that some of the field will receive too much water and the irrigation application is less than 100% efficient. For scheduling purposes, both the distribution uniformity and the application efficiency are important. The distribution uniformity (DU) is a measure of how evenly water soaks in across the field and application efficiency (AE) is a measure of how much of the water applied contributes to ETc.
The following figure conceptually shows how the application efficiency varies when a hypothetical system with perfect distribution uniformity (DU=100%) is used to under-irrigate, over-irrigate, and apply the correct amount. The four arrows indicate the depth of irrigation water applied is the same for all four quarters of the field. In the upper figure, the application amount is less than the soil water depletion (SWD). In this case, all of the water applied is stored in the rooting zone, so the application efficiency is AE=100%. In the middle figure, all four quarters of the field receive twice as much water than the soil can hold, so only half of the water applied is stored in the rooting zone and AE=50%. In the bottom figure, all four quarters of the field receive an amount exactly equal to the SWD and AE=100%. The bottom figure would be an ideal irrigation where all of the field would receive exactly the amount needed to bring the water content back up to FC.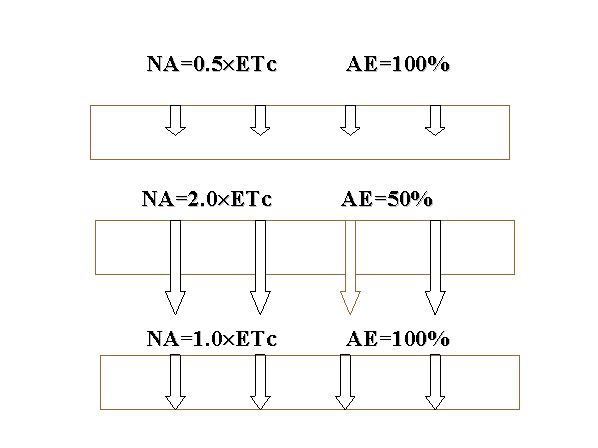
The following figure conceptually shows how the AE varies for a hypothetical irrigation system with a non-perfect distribution uniformity (DU=80%). In the upper figure, none of the four quarters receives an amount greater than the SWD, so the AE=100%. In the middle figure, the low quarter receives 120% of the SWD, so the other quarters also receive more than needed. In this situation, less than 80% of the water applied is stored in the rooting zone, so the AE<80%. In the bottom figure, the low quarter application exactly matches the SWD, and approximately 80% of the water applied is stored in the rooting zone, so the AE=80%. Note that 3/4 of the field is over irrigated when the application to the low quarter equals the SWD before irrigating.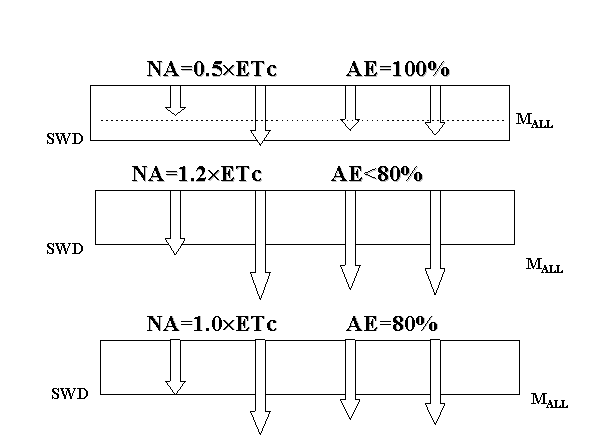
For a well-drained field, if there is no runoff from the field and if the gross application (GA) is equal to NA divided by the DU (expressed as a fraction) then the AE is approximately equal to the DU. The goals in good irrigation management are to apply
and to design and maintain the irrigation system with the highest DU possible. This will result in the highest possible AE while insuring that the actual application amount to the fourth of the field receiving the least water is equal to NA. In general, this should provide the best possible irrigation management. However, if salinity is a problem, then the NA should be increased to include a leaching requirement before calculating GA.
Example
If NA=0.84 inches and the DU=0.90, then![]() inches
inches
Since 0.67 inches corresponds to the YTD that was calculated earlier, a GA=0.74 inches is the maximum gross application that should be applied.
Distribution uniformity (DU)
The distribution uniformity is found by performing a system evaluation. Sample flow rates are measured from a representative sample of emitters. A volume of water is collected from each sample emitter over a fixed time period and the flow rate in gallons per hour per emitter (or liters per hour per emitter) is calculated. Then the samples are ranked from smallest to largest and the mean of the low quarter (MLQ) is calculated as the mean of the 1/4 of the samples receiving the least volume of water. Then the overall mean (MALL) is computed and the DU is calculated as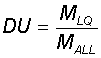
The DU is usually multiplied by 100 and reported as a percentage. However, use the DU as a fraction to calculate the gross amount to apply (GA).
The following table illustrates the procedure used to calculate the DU. Column 2 contains the water collected in gallons per hour in the order sampled. The same data are ranked from smallest to largest in column 3. Because there are 20 samples, the mean of the five smallest numbers is the mean of the low quarter (MLQ). In this data set, the MLQ=0.89 gph. The overall mean is MALL= 1.06 gph. Then, the DU is calculated as the MLQ divided by the overall mean (MALL) or DU=0.84=84%.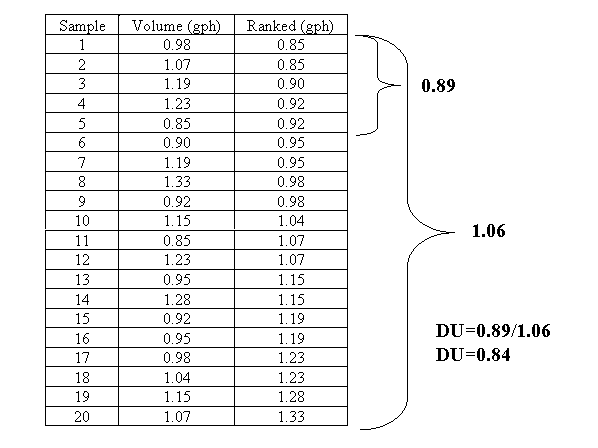
Runtime (RT)
After computing the gross application, the runtime (RT) needed to apply the GA is found by dividing GA by the application rate (AR). The AR is equal to MALL from the system evaluation, but it is first converted to inches or millimeters. To convert from gph per emitter to inches applied to the field per hour, multiply MALL by the number of emitters per acre and divide by 27154 gallons per acre-inch.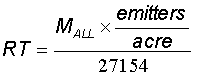 inches per hour
Example
If MALL=5.88 gph per emitter and there are 90 emitters per acre then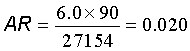 inches per hour
Therefore, a 24-hour runtime would result in a gross application of![]() inches
inches
and, for a well-drained soil, if the AE=DU=0.90, then this corresponds to a net application of![]() inches
inches
Therefore, any net application bigger than 0.43 inches will require more than a 24-hour irrigation
Management Allowable Depletion (MAD)
The management allowable depletion (MAD) is the soil water depletion value that is used to time irrigation events. The MAD is selected to fit with other management constraints, but it should always be smaller than the YTD to avoid yield reducing water stress.
For illustrative purposes, a net application (NA) corresponding to a 24-hour set will be used for the MAD. In our earlier examples, the NA for 24-hour set was 0.43 inches, which is smaller than the YTD values 0.67 inches. Therefore, no problem with yield reduction is expected if MAD=0.43 inches is used.
Irrigation Scheduling
The calculated YTD is useful to time irrigation. Crop evapotranspiration (ETc) is calculated on each day and the cumulative ETc provides an estimate of the soil water depletion (SWD). The crop should be irrigated before the SWD exceeds the YTD.
Example
The following is a scheduling example for a micro-sprinkler irrigated citrus crop. Assuming the SAW=4.0 inches, AD=50%, and CV=0.33, the PAW=1.33 inches and the YTD» 0.67 inches. The application rate is 0.020 inches per hour and a 24-hour set results in a GA=0.48 inches. A system evaluation was performed and the DU=0.90, so the NA corresponding to a 24-hour set is NA=0.43 inches. For the schedule, a MAD=0.43 is used. Assuming the SWD=0 on day 0, the following table shows how the irrigation is timed during a typical summer period.
Irrigation scheduling example for citrus
| Day | ETc | SWD | NA | GA | RT |
| Inches | Inches | Inches | Inches | Hours | |
| 1 | 0.17 | 0.17 | |||
| 2 | 0.16 | 0.33 | 0.33 | 0.37 | 18.5 |
| 3 | 0.15 | 0.15 | |||
| 4 | 0.17 | 0.32 | 0.32 | 0.36 | 18.0 |
| 5 | 0.14 | 0.14 | |||
| 6 | 0.15 | 0.29 | 0.29 | 0.32 | 16.0 |
| 7 | 0.16 | 0.16 | |||
| 8 | 0.17 | 0.33 | 0.33 | 0.37 | 18.5 |
| 9 | 0.17 | 0.17 | |||
| 10 | 0.16 | 0.33 | 0.33 | 0.37 | 18.5 |
Note that irrigation is applied on the day before the SWD exceeds the MAD. It is assumed that an application will return the soil water content to FC, so the SWD is reset to zero on the irrigation date. The SWD on the next day following an irrigation equals ETc on that day. In all cases, GA is calculated by dividing NA by the DU and RT is computed by dividing GA by AR. This procedure is repeated throughout the season.
Lasted updated July 11, 2000