User’s Guide for RTcitrus
IS003 Quick Answer
R. L. Snyder, Biometeorology Specialist
Department of Land, Air and Water Resources
University of California
Davis, CA 95616, USA
N.V. O’Connell, Farm Advisor
UCCE Tulare County
Ag Bldg Co Civic Ctr
Visalia, CA 93291, USA
Copyright – Regents of the University of California
Created – July 2000
Last Revision –July 2001
Introduction
RTcitrus is an Excel program for calculating an irrigation schedule for citrus orchards using drip and micro-sprinkler irrigation systems. To obtain a copy of the program, click on RTcitrus. To use the program, you must know the mean application rate of the system in gallons per hour per emitter, the number of emitters per acre, and the distribution uniformity. This information is found by performing an irrigation system evaluation using the program “DU”. The mean daily reference evapotranspiration (ETo) rates and mean number of rainy days by month for your region are available from your local Cooperative Extension Office, the University of California Integrated Pest Management IPM web page, or from the California Irrigation Management Information System (CIMIS).
Estimating Crop Evapotranspiration
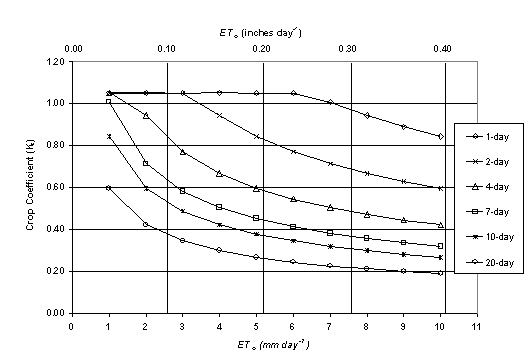
The RTcitrus program uses historical average reference evapotranspiration (ETO) rates and rainy days per month to compute daily ETO for bare soil over the year. The crop coefficient (KC) for bare soil is estimated using equations that give the KC curves for various wetting frequencies and ETO rates as shown in the figure below. The crop evapotranspiration (ETC) rate for bare soil is calculated using Equation 1.
![]() 1)
1)
The program also uses Equation 1, the ETO rates and a peak KC value to estimate the crop evapotranspiration for mature citrus over the year. In general, the peak KC values for mature citrus are about 0.60, 0.65 and 0.70 for the desert, Central Valley, and coastal areas of California, respectively. The correction factor (F) is used to estimate ETC for immature trees. For trees with less than 63% ground cover (GC),
![]() (2)
(2)
and F = 1.0 for GC³63%. Therefore, the ETC for a citrus orchard is calculated as
![]() (3)
(3)
Finally, for each day of the year, ETC is calculated using Equation (3) unless the calculated soil evaporation is higher. Then the soil evaporation rate is used for ETC.
Calculating Applied Water (Gross Application) Amounts
The actual amount to apply depends on the application efficiency (AE) in addition to the ETC. Cumulative ETC between irrigation events provides an estimate the soil water depletion (SWD). Application efficiency is the ratio of water stored in the root zone for use in evapotranspiration divided by the amount applied. Assuming there is good drainage, the AE is approximately equal to the system distribution uniformity (DU). Therefore, for well-drained soils, the gross application (GA) is estimated as

where DU is the distribution uniformity expressed as a fraction.
Calculating the Runtime
The runtime is computed by dividing the GA in inches by the application rate (AR) in inches per hour.

Using the RTcitrus Program
The RTcitrus program has three input and two output worksheets. The historical and rainfall frequency data are entered by month into the “HETo” worksheet. Then the crop and irrigation system information is input into the “System” worksheet. A sample entry is shown in the figure below. It is important to enter the proper peak KC value. The year is input so the program knows whether to include February 29. The ETO zone is the zone where from the California ETO map where your orchard is located. For immature orchards, estimated ground cover percentages must be input next to the proper date in the “System” worksheet. If the cells are left blank, the program assumes that the crop is mature. The distribution uniformity, application rate in gallons per hour per emitter and the number of emitters per acre must be input. The application rates in gallons per minute per acre and in inches per hours will automatically appear.
| Peak Kc = | 0.67 | ||
| Year = | 2001 | ||
| ETo Zone = | 12 | ||
| ground cover on 1 Jan = | 70 | % | |
| ground cover on 1 Apr = | 70 | % | |
| ground cover on 1 Jul = | 70 | % | |
| ground cover on 1 Oct = | 70 | % | |
| ground cover on 31 Dec = | 70 | % | |
| Distribution Uniformity = | 83 | % | |
| Application Rate = | 6.01 | gph/emitter | |
| Number of Emitters = | 121 | emitters/acre | |
| AR = | 12.1 | gpm/acre | |
| AR = | 0.027 | in/hr |
After input of the necessary data, two output tables are computed. The runtime needed to replace soil water loss to ETC is displayed in the worksheet “RT” by month and day. In the worksheet “CRT”, the cumulative runtime is displayed for each day of the year. These runtimes assume that there is no contribution to ETC coming from rainfall. For growers with a cover crop, a correction for the Kc is input directly into the “Schedule” worksheet (column H) on appropriate days. The correction should be a fraction (typically 0.25-0.35). The input value is added to the Kc value of an orchard with no cover crop. The peak Kc is not allowed to exceed Kc=1.10.
To use the RT output table, simply add up the number of hours from the previous to the new irrigation date. This is number of hours that your system should be run to add approximately the cumulative ETC to the low quarter (i.e., the fourth of the field receiving the least water). This means that 3/4 of the crop will likely receive more than the SWD. However, using this method in a well-drained field insures that most of the field is returned to field capacity.
To use the CRT output table, subtract the number of hours on the previous from the new irrigation date. This again is the number of hours that your system should be run for a well-drained soil.
Soils with Poor Drainage
Soils with poor drainage present a problem because the AE is bigger than the DU. There is no easy way to know AE in this situation. If the soil has a perched water table, it may be that all of the water applied is stored and can contribute to ETC. Then, the AE would equal 100%. However, the water may not be distributed evenly across the orchard. However, if water logging is a problem, it may be beneficial to divide the SWD by a number bigger than the DU and possibly as big as 100%. This will result in a smaller application and less water logging. However, when you do this, be sure to monitor the water table depth at several locations in the orchard with a piezometer. To use the RTcitrus program for scheduling irrigation in an orchard with a perched water table, start with AE=DU and gradually increase the value for AE up to 100%. This should gradually decrease water logging in much of the orchard. If a water table still exists, increasing the AE to more than 100% may be necessary.